01 / 05
It’s Time to Shelf the Myths About Food Prices

Blog Post | Food Prices

It’s Time to Shelf the Myths About Food Prices

Measure the time needed to earn the money to pay for a meal. That’s what matters.

Summary: Despite widespread complaints about soaring grocery bills, Americans are spending far less of their working time to put food on the table than earlier generations did. Measured in time prices, long-term trends show food has grown more abundant thanks to rising wages. While household budgets face real pressures elsewhere, the idea of an unprecedented food-affordability crisis simply isn’t supported by the evidence.


With one big family-gathering meal out of the way and more soon to come (Christmas? New Year’s? Super Bowl?), let’s talk about food prices and the “affordability crisis” much in the news and in politicians’ rhetoric. Judging from polls, many Americans believe that the grocery prices are slipping out of reach. Inflation since 2021 left a mark on household budgets, but step back from the checkout line and look at the longer record. Measured the way people experience prices — through hours of work — food at home has become more affordable, not less.

Start with the relationship that matters: wages versus prices. Using Bureau of Labor Statistics data on blue-collar pay and the consumer price index for “Food at Home,” we can compare wage growth with grocery inflation over multiple time horizons. Over the past year, blue-collar wages rose 3.8 percent while supermarket prices rose 2.7 percent. Over the past two years, wages increased 8.1 percent compared with a 4 percent rise for food. Over 10 years, wages rose 49.5 percent, prices 29.7 percent. Over 30 years, wages climbed 169 percent, prices 111 percent. Over 50 years, wages rose 558 percent, food prices 403 percent.

Put differently, wages grew about 40 percent faster than food prices over the past year, with often higher jumps in the other annual comparisons. The longer the period, the larger the cumulative advantage for workers.

The most useful way to express this advantage, as we argued in our 2022 book “Superabundance,” is not in dollars but in “time prices.” Americans buy goods with money, but pay for them with time. To calculate a time price, divide the dollar price of a good by the hourly wage. The result is the number of minutes a worker must spend on the job to earn that good.

Applying this measure to the American Farm Bureau Federation’s annual survey of the ingredients for a Thanksgiving meal serving 10 people — or any other similar holiday feast or special occasion, for that matter — reveals fascinating information about basic “affordability.”

In dollar terms, the Farm Bureau basket rose from $28.74 in 1986 to $55.18 in 2025, a 92 percent increase; over the same period, the blue-collar hourly wage rose from $8.92 to $31.33, a gain of 251 percent. Once you convert those figures into time prices, an even more reassuring picture emerges. In 1986, a blue-collar worker had to work 3.22 hours to buy that dinner for 10. By 2025, the same meal required 1.76 hours. The time price fell 45.3 percent. For the time increment required to buy that meal in 1986, a worker can now buy 1.83 of them — nearly doubling what the labor will buy. Food abundance for that worker rose 83 percent.

This reflects a broader pattern. U.S. consumers spent about 17 percent of disposable personal income on food in 1960; by 2019, that share had fallen to 9.5 percent, driven largely by more affordable food at home. Even after the inflation spike in recent years, Americans last year devoted 10.4 percent of disposable income to food, still roughly half the share common in the mid-20th century and lower than in most other countries. That is a textbook case of Engel’s law: As incomes rise, the share of income spent on food declines.

What produced these gains is not mysterious. Better seeds, fertilizers, machinery, transport, refrigeration, packaging, inventory management and data systems all raise agricultural productivity. Competition in retailing and global trade further push producers to deliver more nutrition for each hour of work on the demand side. The result shows up not only in fuller supermarket shelves but in long-run trends in wages, prices and time prices.

None of that denies the pressure that higher rents, insurance premiums or interest rates place on families. Nor does it imply that every household shares equally in the gains. Time prices capture the average worker, not the person between jobs or outside the labor force. Policy debates about safety nets, housing supply or tax burdens remain important.

But when political candidates and commentators claim that food has never been less affordable, the evidence does not support them. In terms of hours of work, the typical American must sacrifice less time than earlier generations to put groceries on the table. That’s worth celebrating in the holiday season.

This article was originally published in the Washington Post on 12/2/2025.

Reuters | Food Prices

UK Food Inflation Falls Despite Energy Shock

“Britain's food industry warned in February that soaring energy costs following U.S. and Israeli strikes on Iran could push food price inflation towards 10% by Christmas.

Six months later, food ​inflation has instead fallen to a near two-year low, as fierce supermarket competition, consumers' resistance to further price rises and better hedging by suppliers helped absorb ‌the shock.”

From Reuters.

Blog Post | Food Prices

Time Pricing the Fourth of July Cookout

Independence and abundance.

Summary: The dollar price of a traditional Fourth of July cookout has increased since 2016, but rising wages have more than offset those higher prices. As a result, Americans spend less time working to earn this year’s Independence Day meal than they did a decade ago. Measured in time rather than dollars, the data show that abundance has continued to grow as the population has increased.


Every year, the American Farm Bureau Federation estimates the cost of a traditional Independence Day cookout. The basket includes summer cookout staples such as cheeseburgers, chicken breasts, pork chops, potato chips, pork and beans, fresh strawberries, homemade potato salad ingredients, fresh-squeezed lemonade ingredients, chocolate chip cookies, and ice cream.

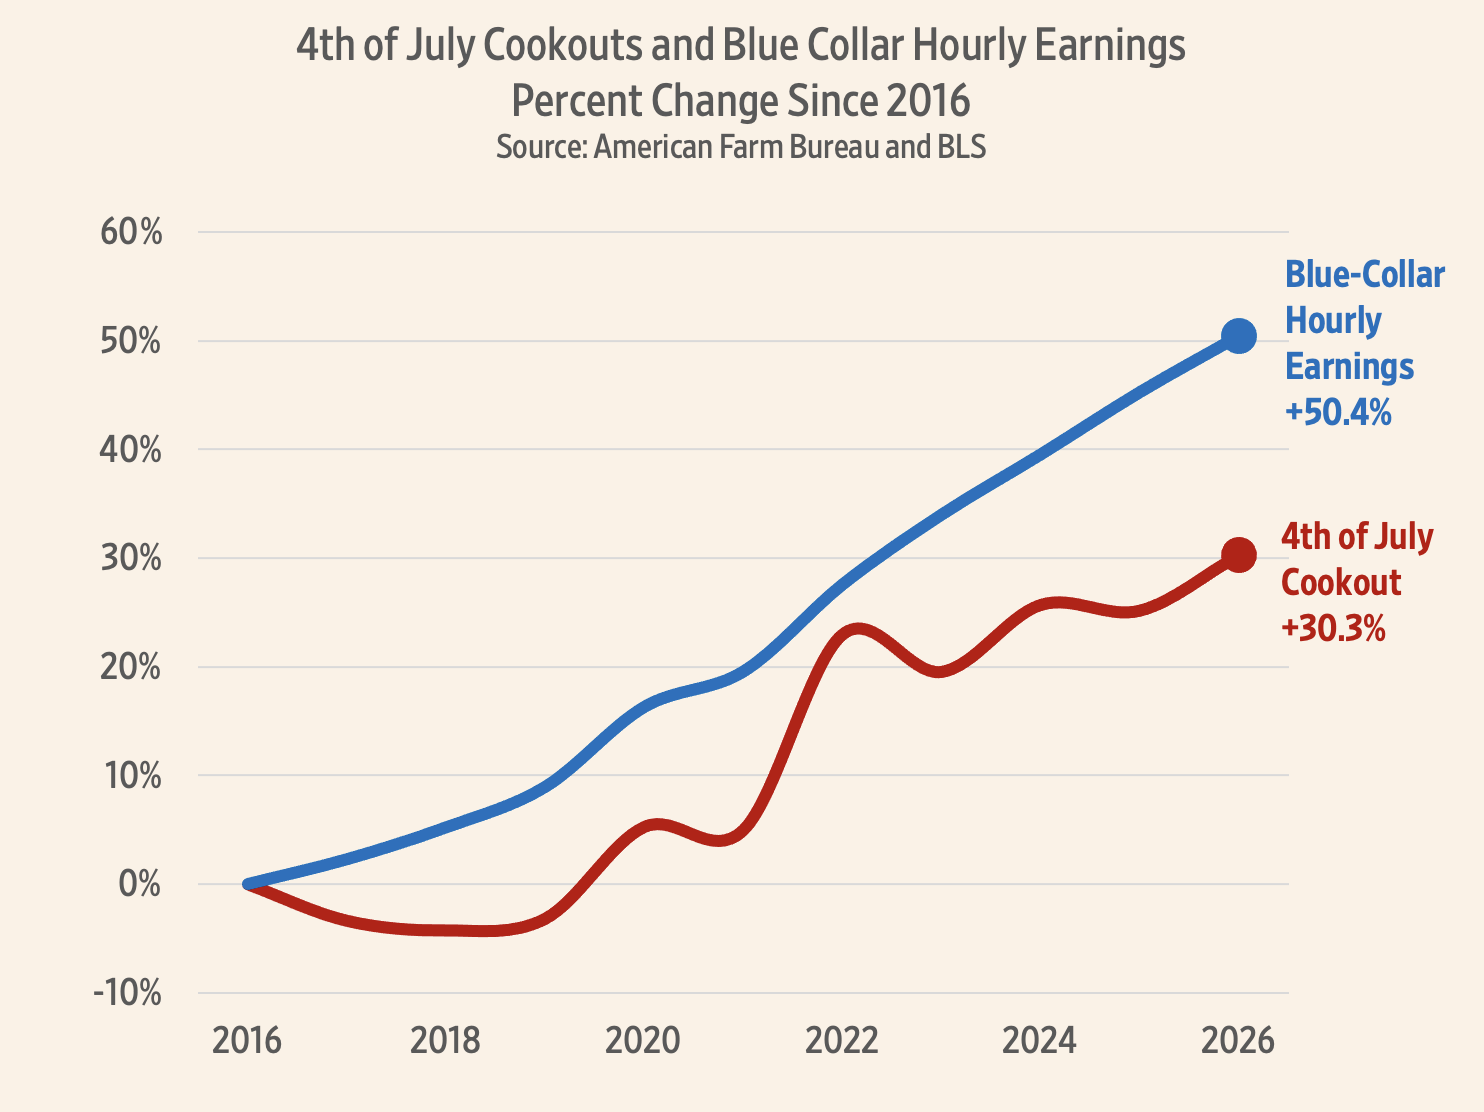
Since 2016, the dollar cost of this basket has risen 30.3 percent, from $56.67 to $73.82. At first glance, that suggests celebrating the Fourth of July has become significantly more expensive.

But money prices tell only half of the story. The real question is not how many dollars the meal costs, but how much time people must work to earn those dollars. Since 2016, blue-collar worker hourly earnings increased 50.4 percent, from $21.48 to $32.31 per hour.

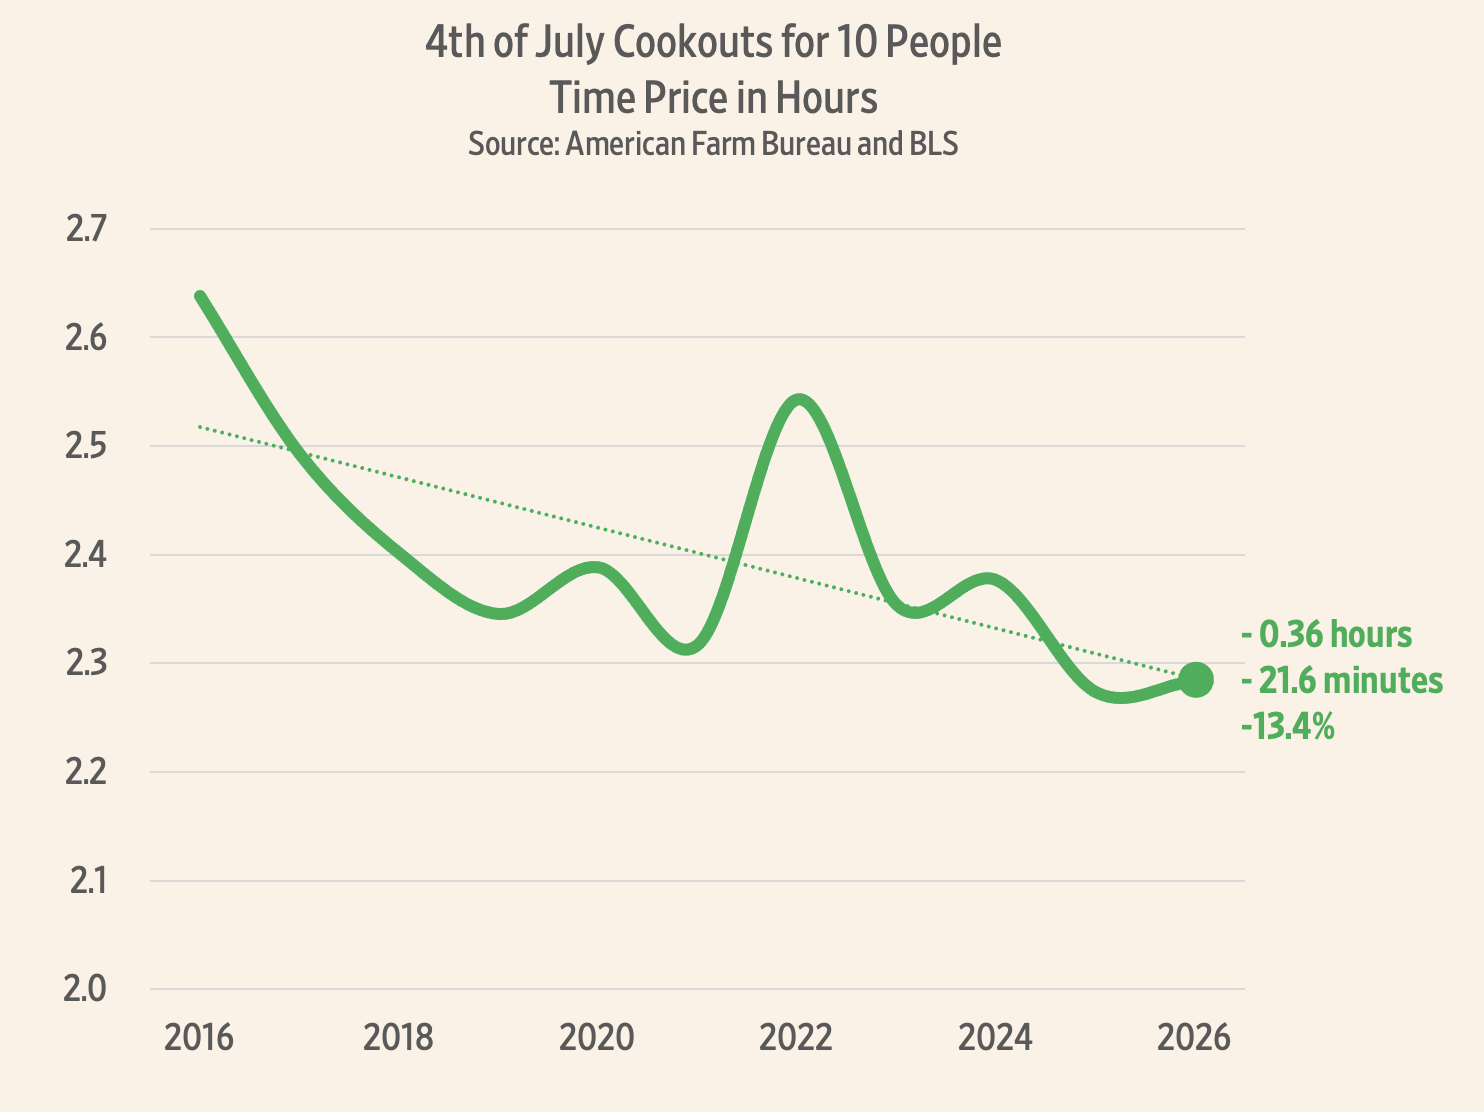
Because wages rose faster than prices, the time price of the cookout actually fell 13.4 percent—from 2.64 hours of work in 2016 to just 2.28 hours today, a savings of 21 minutes.

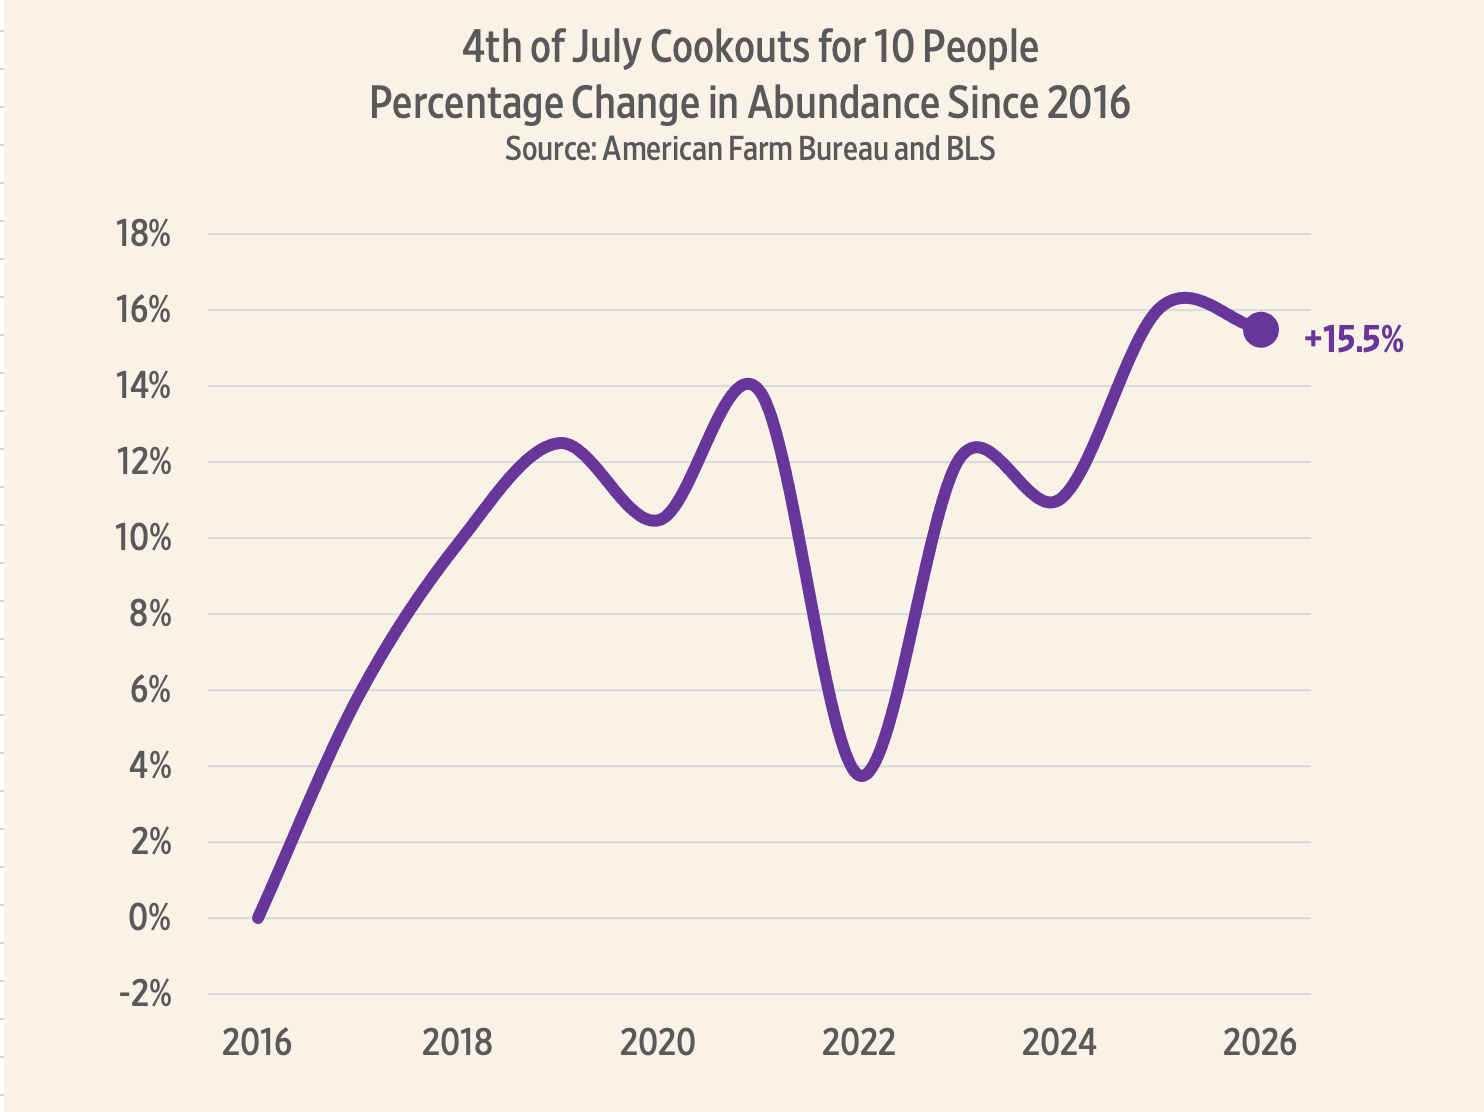
Another way to measure progress is to ask: How much more does the same hour of work buy? We call this the abundance multiplier. Compared with 2016, the same amount of work today buys 15.5 percent more.

America added 22 million people between 2016 and today, a population increase of 6.8 percent. Yet abundance didn’t merely keep pace with population—it grew 2.28 times as fast. Every 1 percent increase in people produced a 2.28 percent increase in cookout abundance. That’s the signature of superabundance: on average, every additional person contributes more than they consume. Even though there are 22 million more of us, we’ll actually spend 7.5 percent less time working as a country to pay for our celebration compared with 2016.

Americans may spend more dollars, but they spend less of their lives earning this year’s Independence Day feast.

Government money printing during the COVID-19 pandemic did cause a temporary spike, but we have returned to the long-term trend of decreasing time prices and increasing abundance.

This year saw a slight reversal. Compared with the record-low time price in 2025, food prices increased 4.1 percent while blue-collar hourly earnings rose 3.5 percent. As a result, the time price of the cookout edged up by just 0.5 percent—less than one minute of additional work. Even after that small increase, the Independence Day cookout remains substantially more affordable in time than it was a decade ago.

Find more of Gale’s work at his Substack, Gale Winds.

Economist Writing Every Day | Food Prices

Berries Are Probably Not Making Parents Go Broke

“The Washington Post recently ran a fun, data-filled article on berry consumption and parenting. Lots of good tidbits in the article, including that Americans eat a lot more berries than in the recent past, and that a lot of the availability is thanks to foreign trade and imports. But despite being somewhat light-hearted, the article does seem very negative, especially in the title and introduction, about how parents are spending a lot of money on berries…

Relative to median wages, berries of all kinds are now more affordable than a decade ago. Parents may still feel squeezed by all the berries their kids are eating, but in terms of affordability and share of the family budget, there is probably no need for a Berry Panic.”

From Economist Writing Every Day.

Blog Post | Food Prices

Time Pricing Big Macs Around the World

Even if a Big Mac is more expensive in money, it can be less expensive in time.

Summary: Big Mac prices across countries can be better understood by measuring them in terms of time rather than money—specifically, how long people must work to afford one. Comparing time prices reveals meaningful differences in wages and productivity that aren’t obvious from currency values alone.


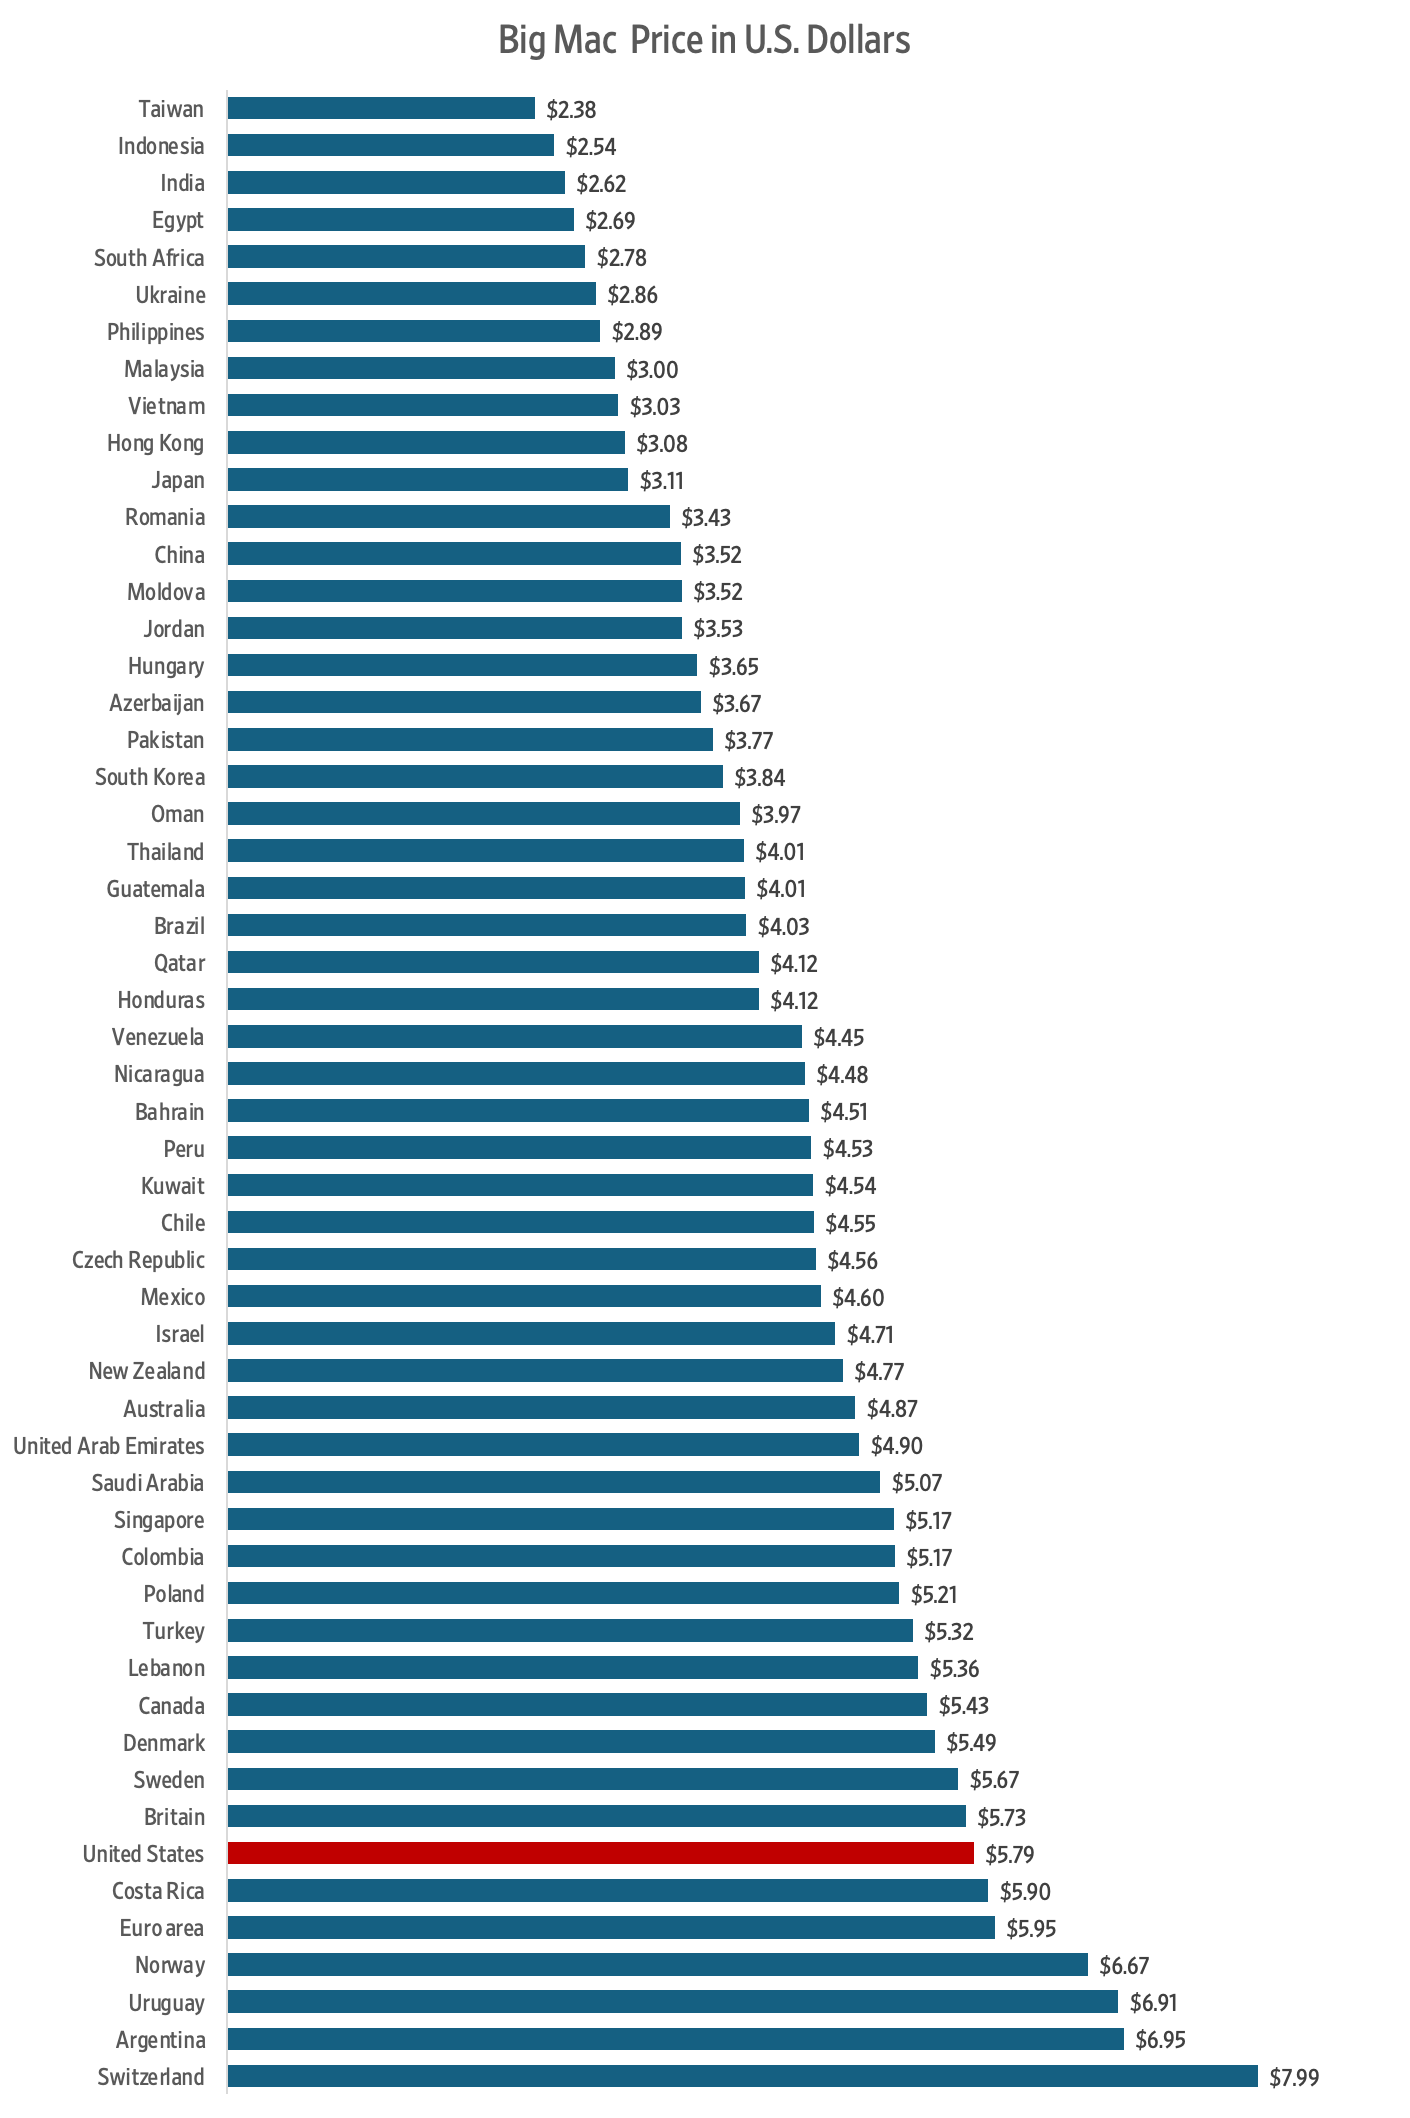
McDonald’s operates in over 100 countries worldwide. Since 1986, The Economist magazine has published the Big Mac Index, built on the theory of purchasing power parity (PPP)—the idea that exchange rates should equalize the price of an identical basket of goods across countries. The following shows the dollar price of a Big Mac in each country, sorted by price:

But we can go one step further.

Instead of comparing currencies, we can compare time.

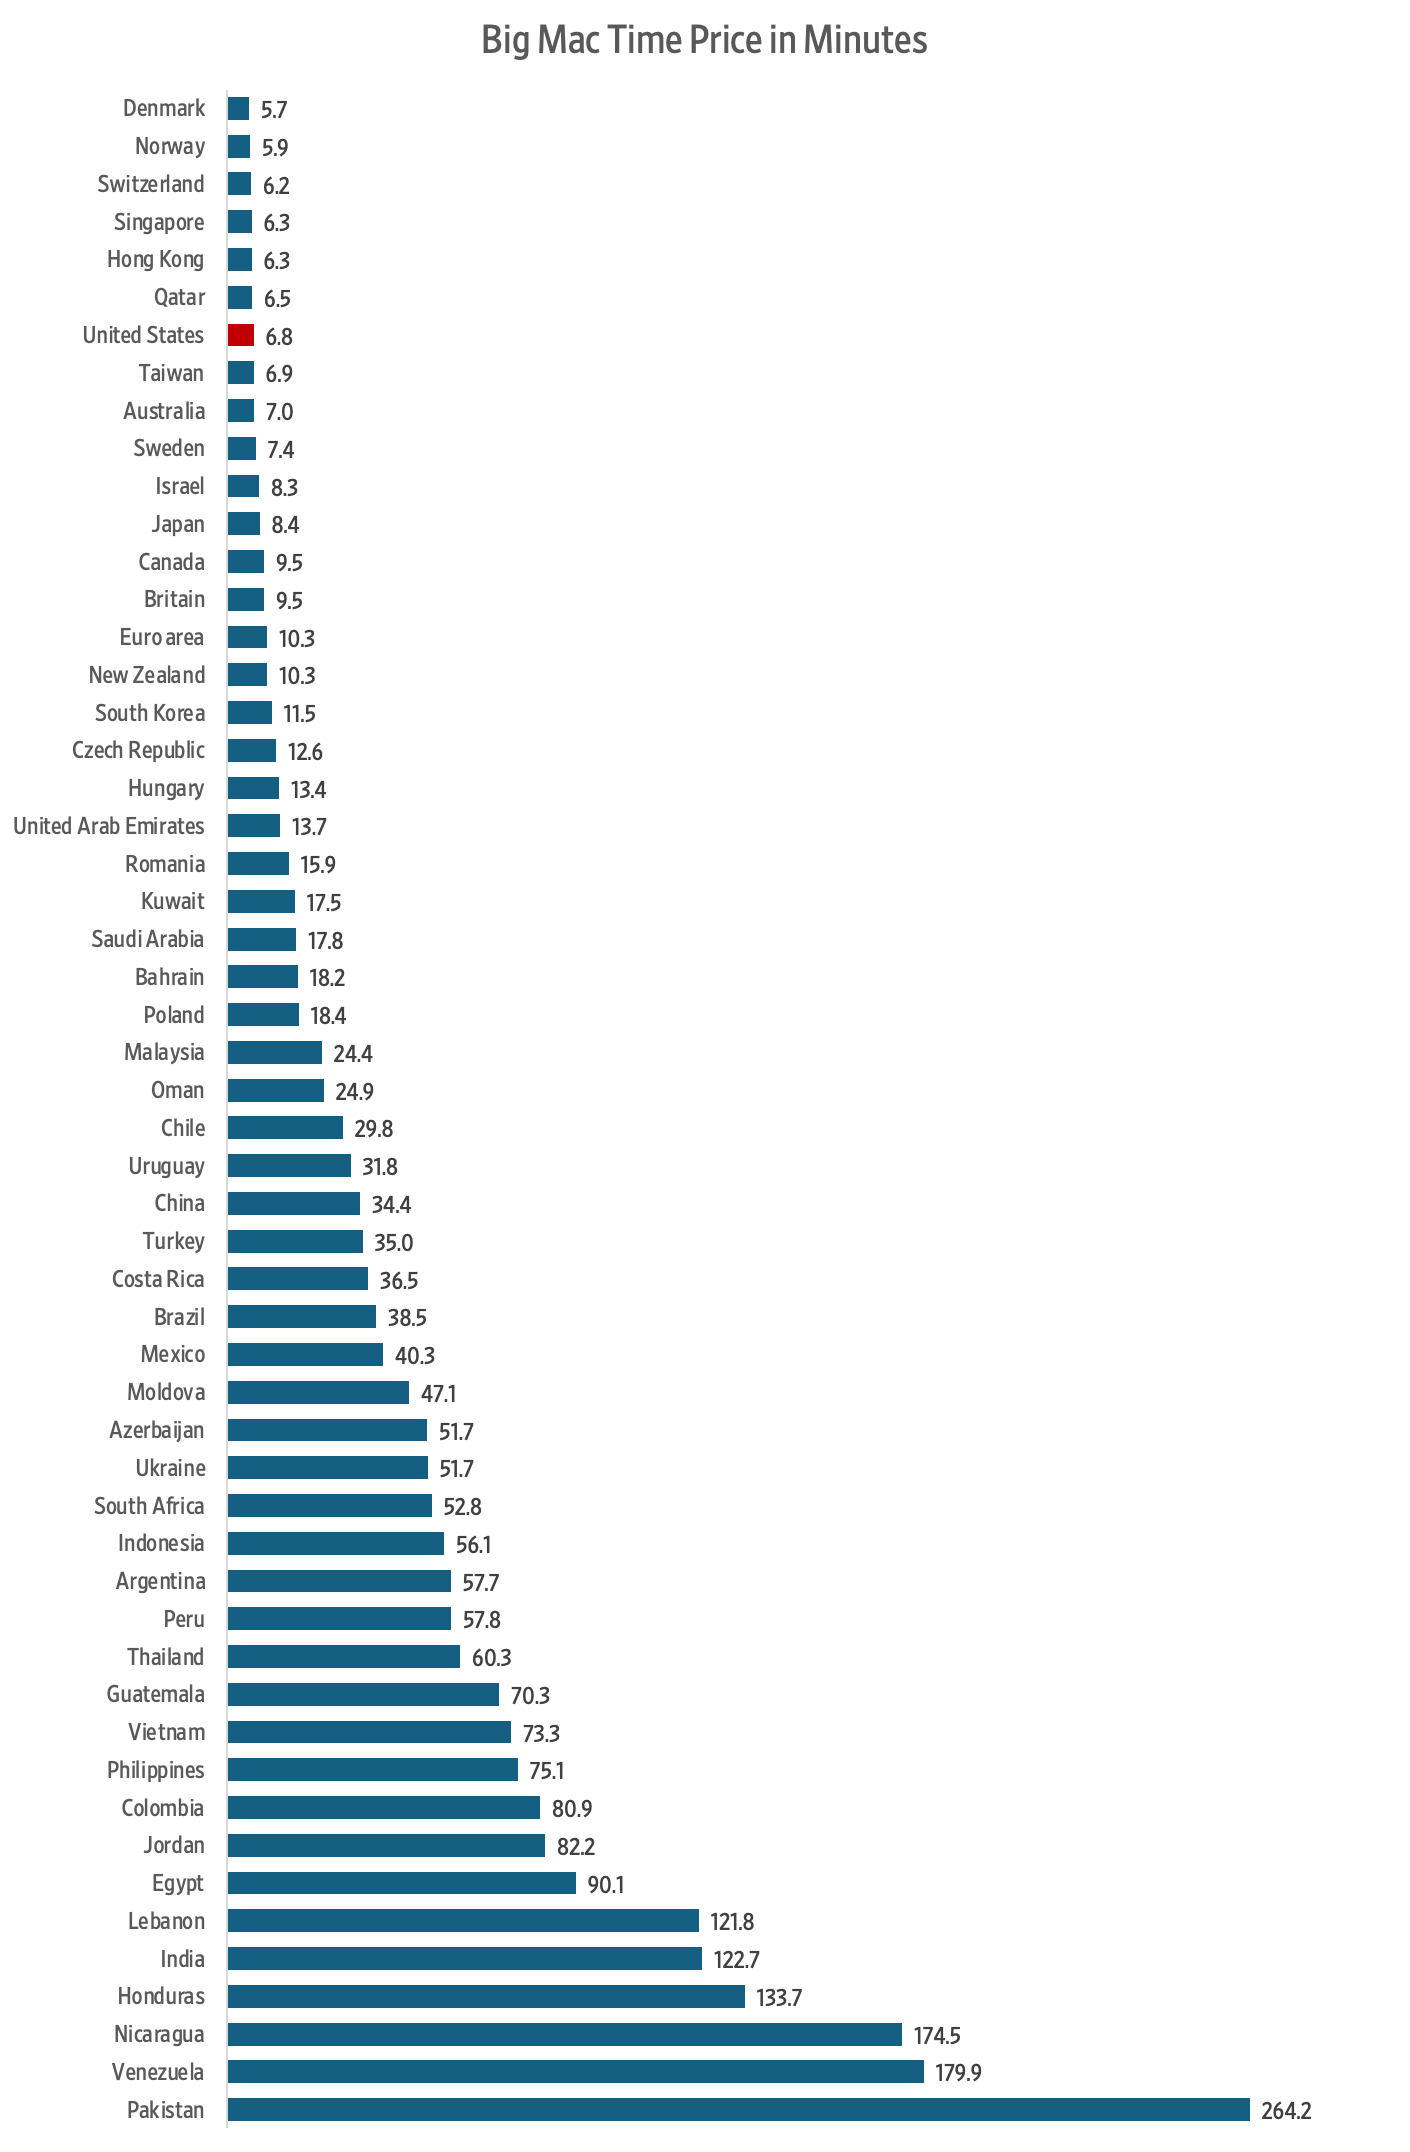
We start with the nominal price of a Big Mac in each country, converted to U.S. dollars, and then compare it to average hourly earnings. Since average hourly earnings data are not available for all countries, GDP per capita divided by annual hours worked serves as a reasonable proxy for relative wages between countries.

This transforms the question from “What does it cost?” to “How long do you have to work to get it?” A Big Mac can be more expensive in money but less expensive in time, depending on where you live.

A Big Mac in Taiwan costs only $2.38, compared to $7.99 in Switzerland, but after adjusting for hourly earnings, the time prices are very similar. In Pakistan, a Big Mac costs $3.77, but hourly earnings are $0.86, putting the time price at 4.4 hours. In Denmark, the price is $5.49, but hourly earnings are $57.60, so the time price is under six minutes. For the time it takes a worker in Pakistan to earn enough to buy one Big Mac, workers in Denmark can buy more than 46.

The Big Mac doesn’t just measure currencies; it measures the spread of knowledge.

What looks like inequality in dollars is often a difference in productivity, learning, and institutional capacity. The real divide is not between rich countries and poor countries—it is between places where knowledge compounds and places where it is constrained.

When a sandwich falls from four hours of work to four minutes, something profound has happened—not to the burger, but to the growth and sharing of knowledge.

The story of abundance is not written in dollars. It is written in time.

Find more of Gale’s work at his Substack, Gale Winds.